Big-Integers: Writing and Optimizing Addition
Adding really big numbers, really fast

In the second post of this series exploring the world of big integers, we will delve into the most fundamental arithmetic operation performed on them — addition.
The basic grade-school addition algorithm is all we need here. Yes, the very one you learnt back in kindergarten. The steps being:
Add the corresponding least significant digits (the digits in the rightmost column) of both numbers, producing a single-digit value along with a carry.
Move onto the next column towards left (if any), summing in the carry value along with the corresponding digits of the column, producing yet another single digit value along with a carry,
Repeat step 2 until you exhaust all the columns,
Return the final carry value generated from the most significant digit column.
That and some familiarity with basic C programming is all we’ll need here.
A simple big integer addition
The C11 standard defines unsigned integer wrap-around as well-defined behavior. We will use this property to implement a simple function, big_add, that adds two arbitrary-precision integers represented in the manner discussed in my last post.
However, there is a small challenge. If the machine has no notion of unsigned integers wider than 64 bits, how do we detect whether a carry was produced due to overflow? One might be tempted to write:
carry = (a + b) > U64_MAX;But this does not work. If a + b exceeds U64_MAX, the result will already have wrapped around to a smaller value before the comparison is evaluated, defeating the purpose of the check.
One correct way to detect overflow is:
carry = a > (U64_MAX - b);This preserves the intent of the original comparison while keeping unsigned integer overflow in mind. Another equivalent approach is:
sum = a + b;
carry = sum < a; // or check (sum < b), either works
But can we guarantee that whenever unsigned overflow occurs, the condition (sum < a) (or equivalently (sum < b)) always holds? As it turns out, we can. But before we get to that, let’s refresh some basic modular arithmetic.
Overflow in unsigned integers works according to the rules of modular arithmetic. Since we are working with 64-bit unsigned integers, it means our sum = a + b can be written more precisely as:

With this in hand, we are ready to prove the overflow detection condition.
The proof
The concise proof of the required condition is as follows:
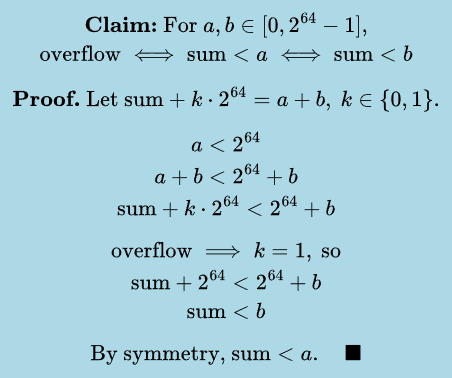
With the claim now established, we have the tool we need to write our code.
The implementation
The implementation of both methods is fairly straightforward. We loop over the “digits” (elements) of each big integer (stored as an array in little-endian ordering), starting from the least significant digit, adding corresponding elements until none remain, and then return the final carry.
Note that we cannot simply write sum = op1[i] + op2[i] + carry. This is effectively two additions, and either one (or neither) may overflow (but not both), which is why we do two separate additions, obtain two separate carries and then use the bitwise OR operator to get the final carry. I will present two versions of the function big_add here by utilizing both kinds of comparisons for determining overflow, which I talked about earlier.
Version 1:
u64 big_add_v1(
    u64* result,
    const u64* op1,
    const u64* op2,
    usize size
)
{
    u64 carry = 0;

    for (usize i = 0; i < size; i++)
    {
        u64 c1 = op1[i] > (U64_MAX - op2[i]);
        u64 sum = op1[i] + op2[i];

        u64 c2 = sum > (U64_MAX - carry);
        sum += carry;

        result[i] = sum;
        carry = c1 | c2;
    }

    return carry;
}
Version 2:
u64 big_add_v2(
    u64* result,
    const u64* op1,
    const u64* op2,
    usize size
)
{
    u64 carry = 0;

    for (usize i = 0; i < size; i++)
    {
        u64 sum = op1[i] + op2[i];
        u64 c1 = op1[i] > sum; // or equivalently (op2[i] > sum)

        result[i] = sum + carry;
        u64 c2 = sum > result[i];

        carry = c1 | c2;
    }

    return carry;
}
Examining compiler generated code
We can examine the code generated by x86-64 clang 21.1.0 with optimization level -O1 and the -std=c11 flag for
As we can see, the compiler generates the exact same code for both versions, which is quite impressive, as it shows the compiler is able to perform such complex pattern matching. The reason for not using optimization level -O2 is that Clang unrolls the loop twice, and that is something I want to avoid for now in order to first benchmark the code as it is.
Since both versions of our big_add function generate the exact same code, I will be sticking with the 2nd version, simply because it looks shorter and cleaner to me. I will be referring to it as big_add_v1 from now on.
Setting up a benchmarking environment
Before comparing different implementations, we must first establish a consistent benchmarking environment. This will allow us to evaluate the performance of our implementation, against a well-optimized, state-of-the-art implementation provided by LibGMP v6.3.0.
Our comparison will specifically target GMP’s low-level big integer addition routine, mpn_add_n. According to the LibGMP documentation, the mpn_* functions form the library’s public low-level interface for multiple-precision arithmetic, operating directly on arrays of machine words which GMP refers to as limbs.
All tests are performed on Fedora Linux 43, with the programs compiled using x86-64 Clang 21.1.8. Compilation is carried out with optimization levels -O2 or -O1, which will be specified explicitly for each test.
The benchmarks are executed on an AMD Ryzen 7 8845HS processor. In order to ensure a fair comparison between implementations and to reduce variability caused by dynamic frequency scaling, CPU turbo boost is disabled during testing.
LibGMP v6.3.0 itself is built from source as a static library, with the x86 fat-binary configuration option enabled during the build process. This configuration allows GMP to include multiple optimized code paths for different x86 microarchitectures while selecting the most appropriate one at runtime. The exact build steps used are:
./configure --enable-fat --enable-static --disable-shared   \
            CC=clang CFLAGS="-O2 -fomit-frame-pointer -std=c11"

make -j$(nproc)

make -j$(nproc) check

sudo make install
Choice of benchmark
Once the build is complete, we can proceed towards writing our benchmark. For this experiment, the benchmark will consist of computing very large Fibonacci numbers.
There are two important points to note.
Fibonacci numbers rapidly exceed the capacity of standard fixed-width integer types. In particular, values beyond the 93rd Fibonacci number can no longer be represented using a 64-bit unsigned integer without incurring overflow. This makes them a good candidate for multiple-precision arithmetic computation. To see why:
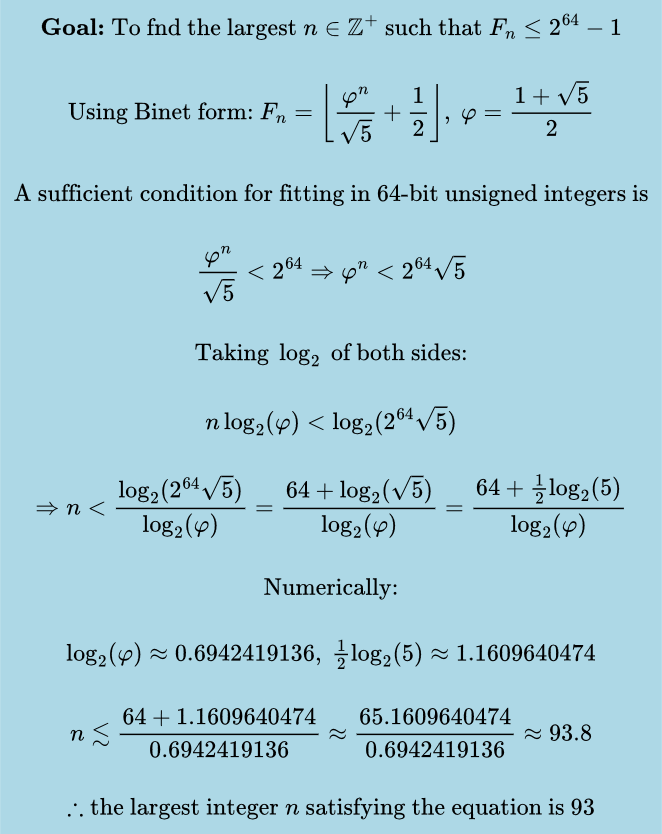
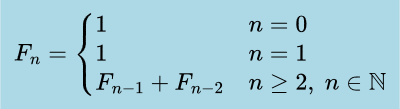
The algorithm used will be the classical iterative method, which repeatedly evaluates the recurrence shown below. Because each addition operates on large integers whose size grows with
n, the cost of a single addition isO(n). Performing this operation for each step up tontherefore yields an overall time complexity ofO(n²).

The benchmark code
The benchmark details are as follows:
The benchmark computes Fibonacci numbers beginning at the
MIN_SIZEterm and continuing up to theMAX_SIZEterm, evaluating Fibonacci numbers at eachSTEP_SIZE. This will yield us(MAX_SIZE - MIN_SIZE) / STEP_SIZE + 1data points for comparison. We will use the following values:#define MIN_SIZE (1000ULL) #define MAX_SIZE (50000ULL) #define STEP_SIZE (500ULL)The timing utility used will be provided via
__rdtsc()compiler intrinsic, as it provides a high-resolution CPU timer on x86-64 CPUs. We will also be utilizing the_mm_lfence()function before and after__rdtsc()calls as a precaution for serializing execution, so out-of-order execution on modern CPUs doesn’t skew our results. It is implemented as follows:u64 get_cpu_time(void) { _mm_lfence(); u64 time = __rdtsc(); _mm_lfence(); return time; }The benchmark will repeatedly compute the same Fibonacci number
ITERATIONStimes. The code will then average out the total run time overITERATIONS, for that particular size, storing it as a data point. We use the following iteration count:#define ITERATIONS (1ULL << 8) // 256ULLThe benchmark will write the data points of type
(size, avg_cycles), to a CSV file namedfunction_name.csv.A simple error checking macro is used to avoid writing checks again and again and instead offload the task to the C pre-processor.
#define ERROR_CHECK(expr, cond, err_msg) \
    do                                   \
    {                                    \
        if (expr == cond)                \
        {                                \
            perror(err_msg);             \
            exit(EXIT_FAILURE);          \
        }                                \
    } while (0)
For determining how many bits are needed in the big integer representation, the following calculation will be used:
#include <math.h>

#define LOG_2_PHI    (double)0.694241913   /* log2(phi) */
#define LOG_2_SQRT5  (double)1.160964047   /* log2(sqrt(5)) */
#define PHI_BITS(N)  (N * LOG_2_PHI - LOG_2_SQRT5 + 1.0f) /* N is term number */
The code for the benchmark is as follows:
void benchmark_big_add_versions(
    const char *csv_path,
    u64 (*func)(u64 *, const u64 *, const u64 *, usize)
)
{
    FILE *fp = fopen(csv_path, "w");
    ERROR_CHECK(fp, NULL, "Failed to open CSV file! Terminating Execution ...");

    u64 *fib[2] = {NULL};
    u64 digits_needed = (u64)ceil(PHI_BITS(MAX_SIZE) / 64);

    fib[0] = malloc(sizeof(u64) * digits_needed);
    ERROR_CHECK(fib[0], NULL, "Malloc failure in benchmark_big_add_versions!");

    fib[1] = malloc(sizeof(u64) * digits_needed);
    ERROR_CHECK(fib[1], NULL, "Malloc failure in benchmark_big_add_versions!");

    fprintf(fp, "N,avg_cycles\n");

    for (usize i = MIN_SIZE; i <= MAX_SIZE; i += STEP_SIZE)
    {
        usize size_needed = (u64)ceil(PHI_BITS(i) / 64.0);

        memset(fib[0], 0, size_needed * sizeof(u64));
        memset(fib[1], 0, size_needed * sizeof(u64));

        fib[0][0] = 1;
        fib[1][0] = 1;

        u64 t1 = get_cpu_time();

        for (u64 j = 0; j < ITERATIONS; j++)
        {
            /* Fibonacci recurrence: F_n = F_(n-1) + F_(n-2) */
            for (usize k = 2; k <= i; k++)
            {
                func(
                    fib[k & 1],
                    fib[1],
                    fib[0],
                    size_needed
                );
            }
        }

        u64 t2 = get_cpu_time();

        fprintf(
            fp,
            "%llu,%0.2f\n",
            (u64)i,
            ((double)(t2 - t1)) / ITERATIONS
        );
    }

    free(fib[1]);
    free(fib[0]);

    fclose(fp);

    return;
}
The benchmarking function accepts a function pointer to the big_add_* variant along with a csv file name to put the results in.
Every function that we write from now on will be benchmarked in the exact same way. The above benchmarks are compiled with x86-64 clang 21.1.8 at the optimization level -O2, linking against the GMP static library that we built from source.
Checking the performance
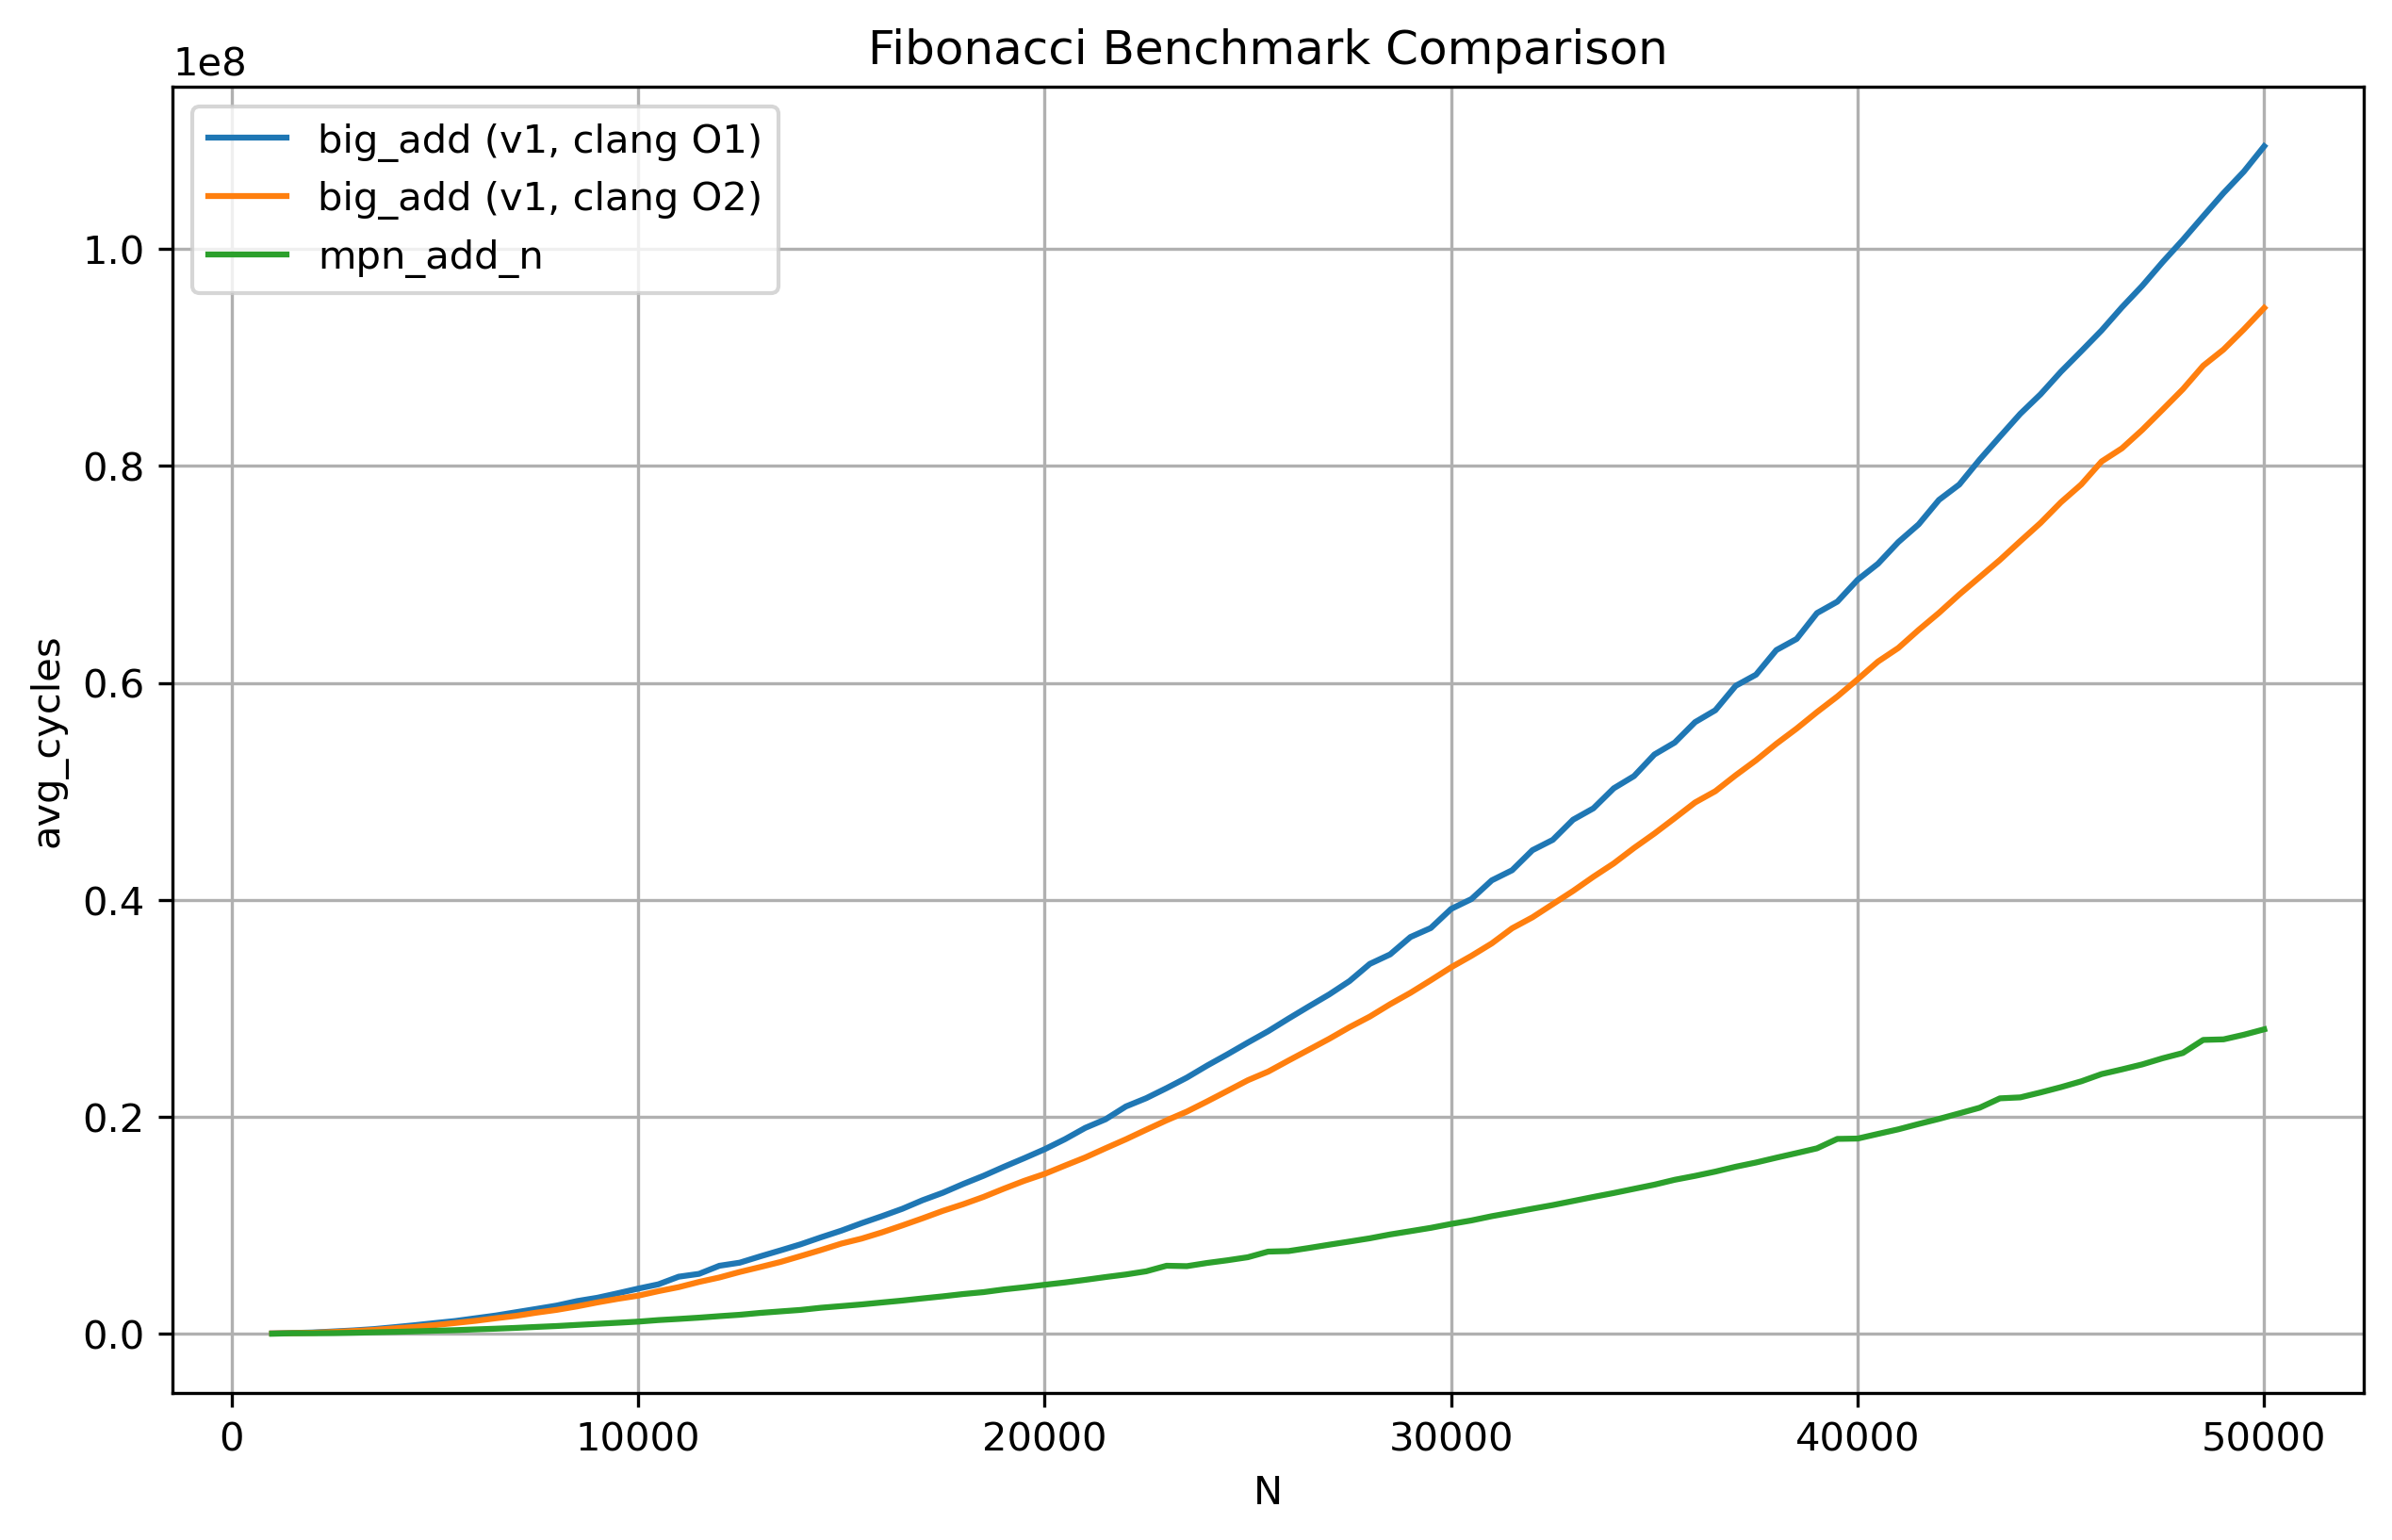
After obtaining some python code from ChatGPT 5.2 for plotting the contents of the csv files onto a line graph, we get the following results:
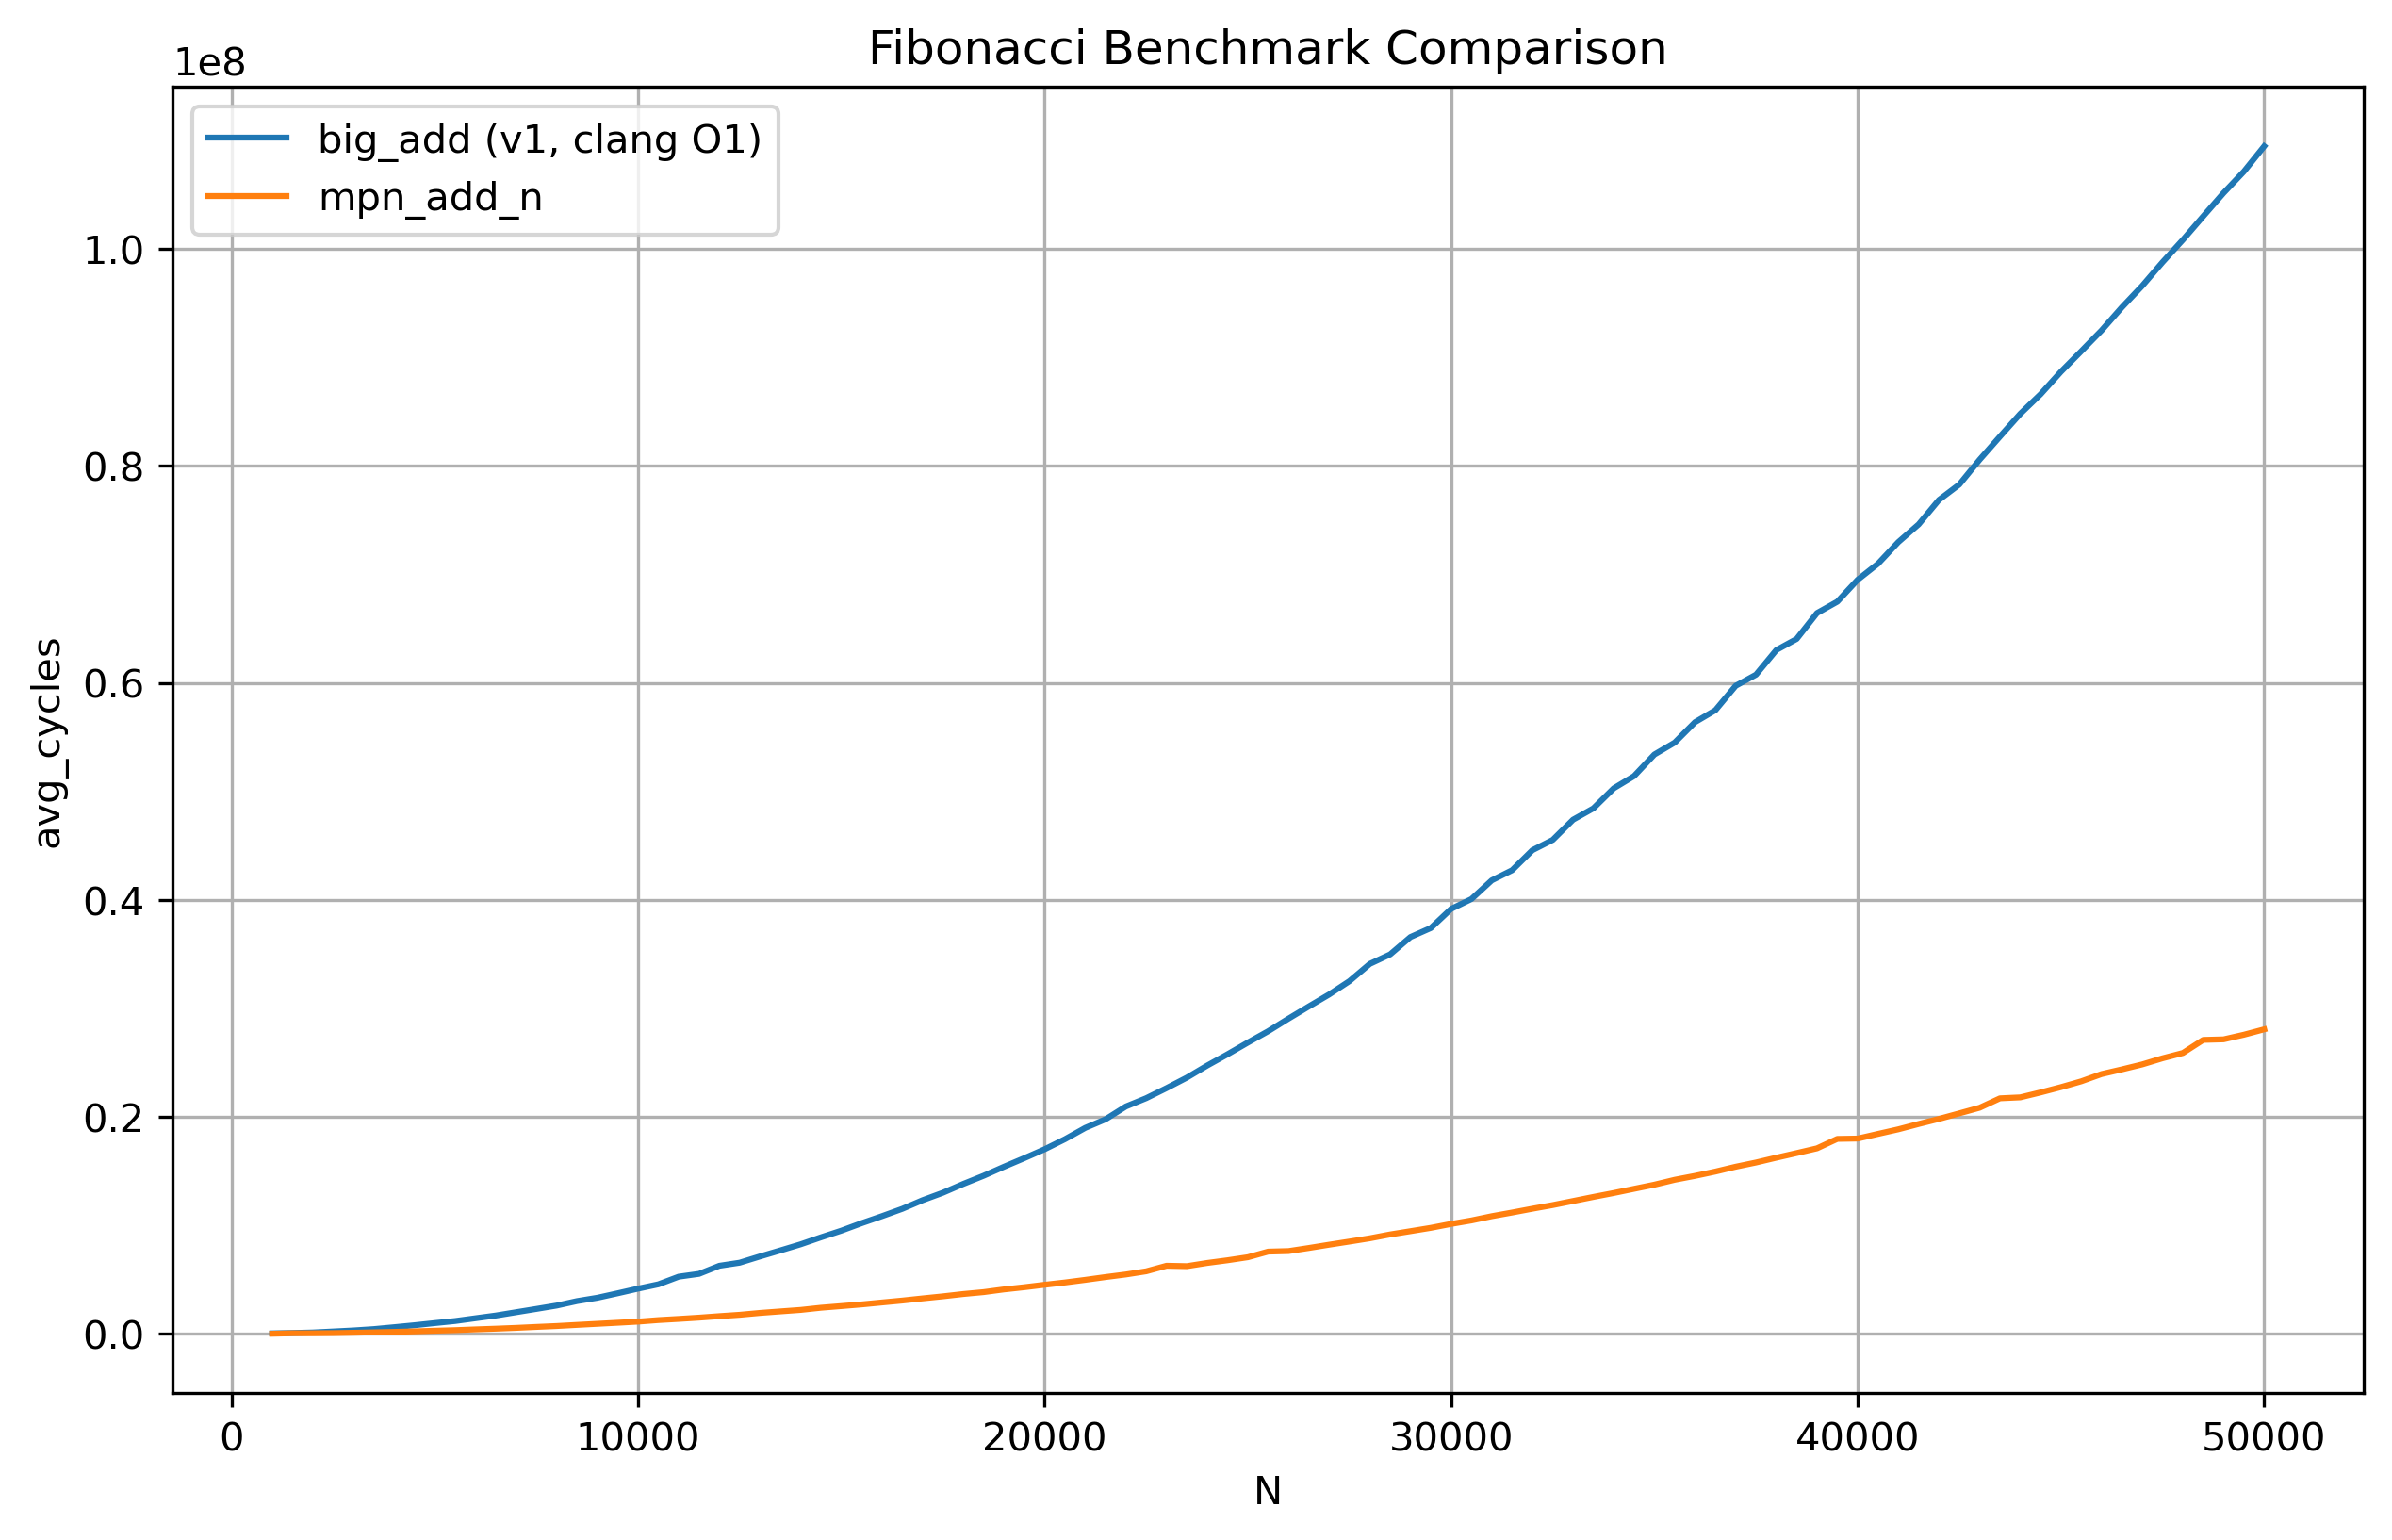
The x-axis represents the Fibonacci term going from the 1000th to the 50,000th term with a step size of 500. The y-axis represents the amount of CPU cycles taken on average. Our first implementation is a few orders of magnitude slower compared to GMP’s heavily optimized mpn_add_n.
Let’s now examine the results at -O2 optimization level for our code.
The performance seems to be a bit better compared to -O1. To now take a look at the average slowdown, we have the following table generated by the python script:
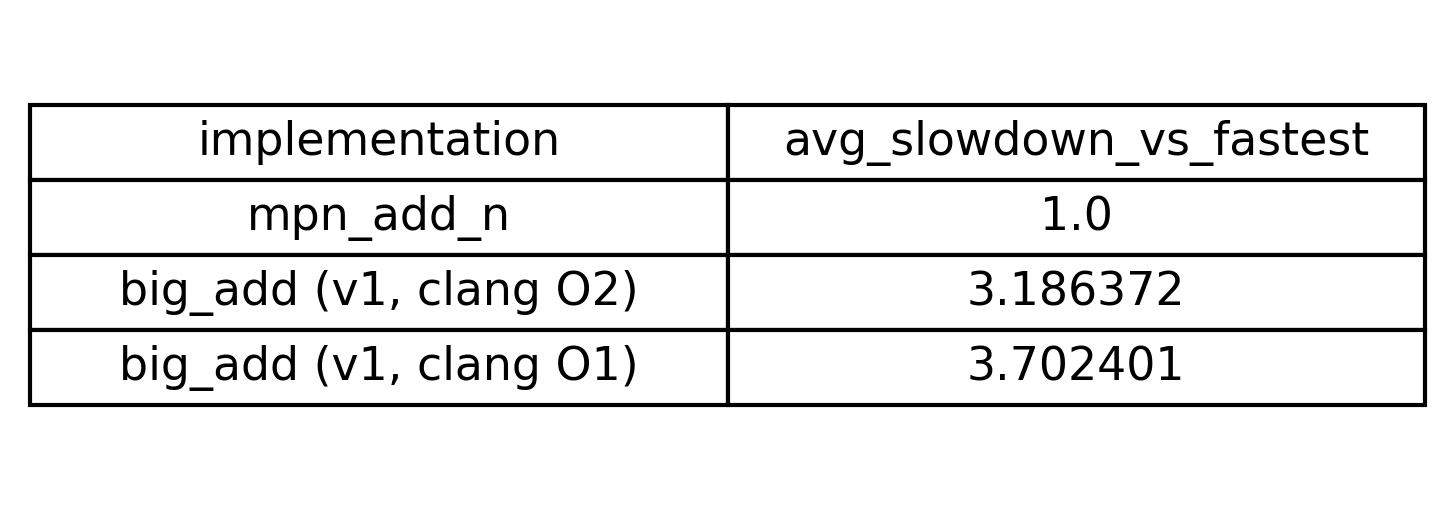
Our clang -O1 code is a whopping 3.7x slower than GMP’s implementation and while clang -O2 code did improve the performance by ~0.5x, I am still not satisfied with these results.
I think we are just getting started here. It’s time for more power.

Taking the performance up by several notches
What if we shed the requirement of portability in our C code and instead go onto getting even more performance from our hardware instead? Using specialized hardware instructions available to us via compiler-intrinsic functions we can do just that.
In our context, I am talking about the ADC instruction available on x86-64 machines, which stands for add-with-carry. It adds two unsigned 64-bit or 32-bit integers along with a carry value and then returns the output sum and a carry value of 1 or 0 based on whether overflow has occurred or not. Looking at the Intel compiler intrinsics guide, we can see the compiler-intrinsic function _addcarry_u64() present in <intrin.h> giving us access to exactly that instruction. Since we are using Clang on a Linux machine, the corresponding header is <x86intrin.h> which hints the compiler to use this specific instruction. We can write the following code:
#include <x86intrin.h>

typedef unsigned char u8;

u64 big_add_v2(
    u64 *result,
    const u64 *op1,
    const u64 *op2,
    usize size
)
{
    u8 carry = 0;
    usize i = 0;

    while (i < size)
    {
        carry = _addcarry_u64(carry, op1[i], op2[i], &result[i]);
        i++;
    }

    return (u64)carry;
}
and that’s it! There’s next to no mental gymnastics involved here because everything from earlier is now handled by hardware for us. But before we go further, it’s important to look at the compiler generated assembly to ensure that the required instruction is actually being generated.
Looking at x86-64 clang 21.1.0 output with flags -O2 and -std=c11 for the above function, and sure enough we can see the compiler generating the ADC instruction:
with the pre-processor directive
#pragma nounrollwith the pre-processor directive
#pragma unroll(8)
The reason for specifically using the #pragma nounroll in (1) is to have our baseline, vanilla variant so we can effectively test the gains we get with unrolling four times and eight times. The purpose of loop unrolling here is to fully utilize multiple CPU execution units that might sit idle if we do not give the CPU enough work in every loop iteration.
Checking the performance (again)
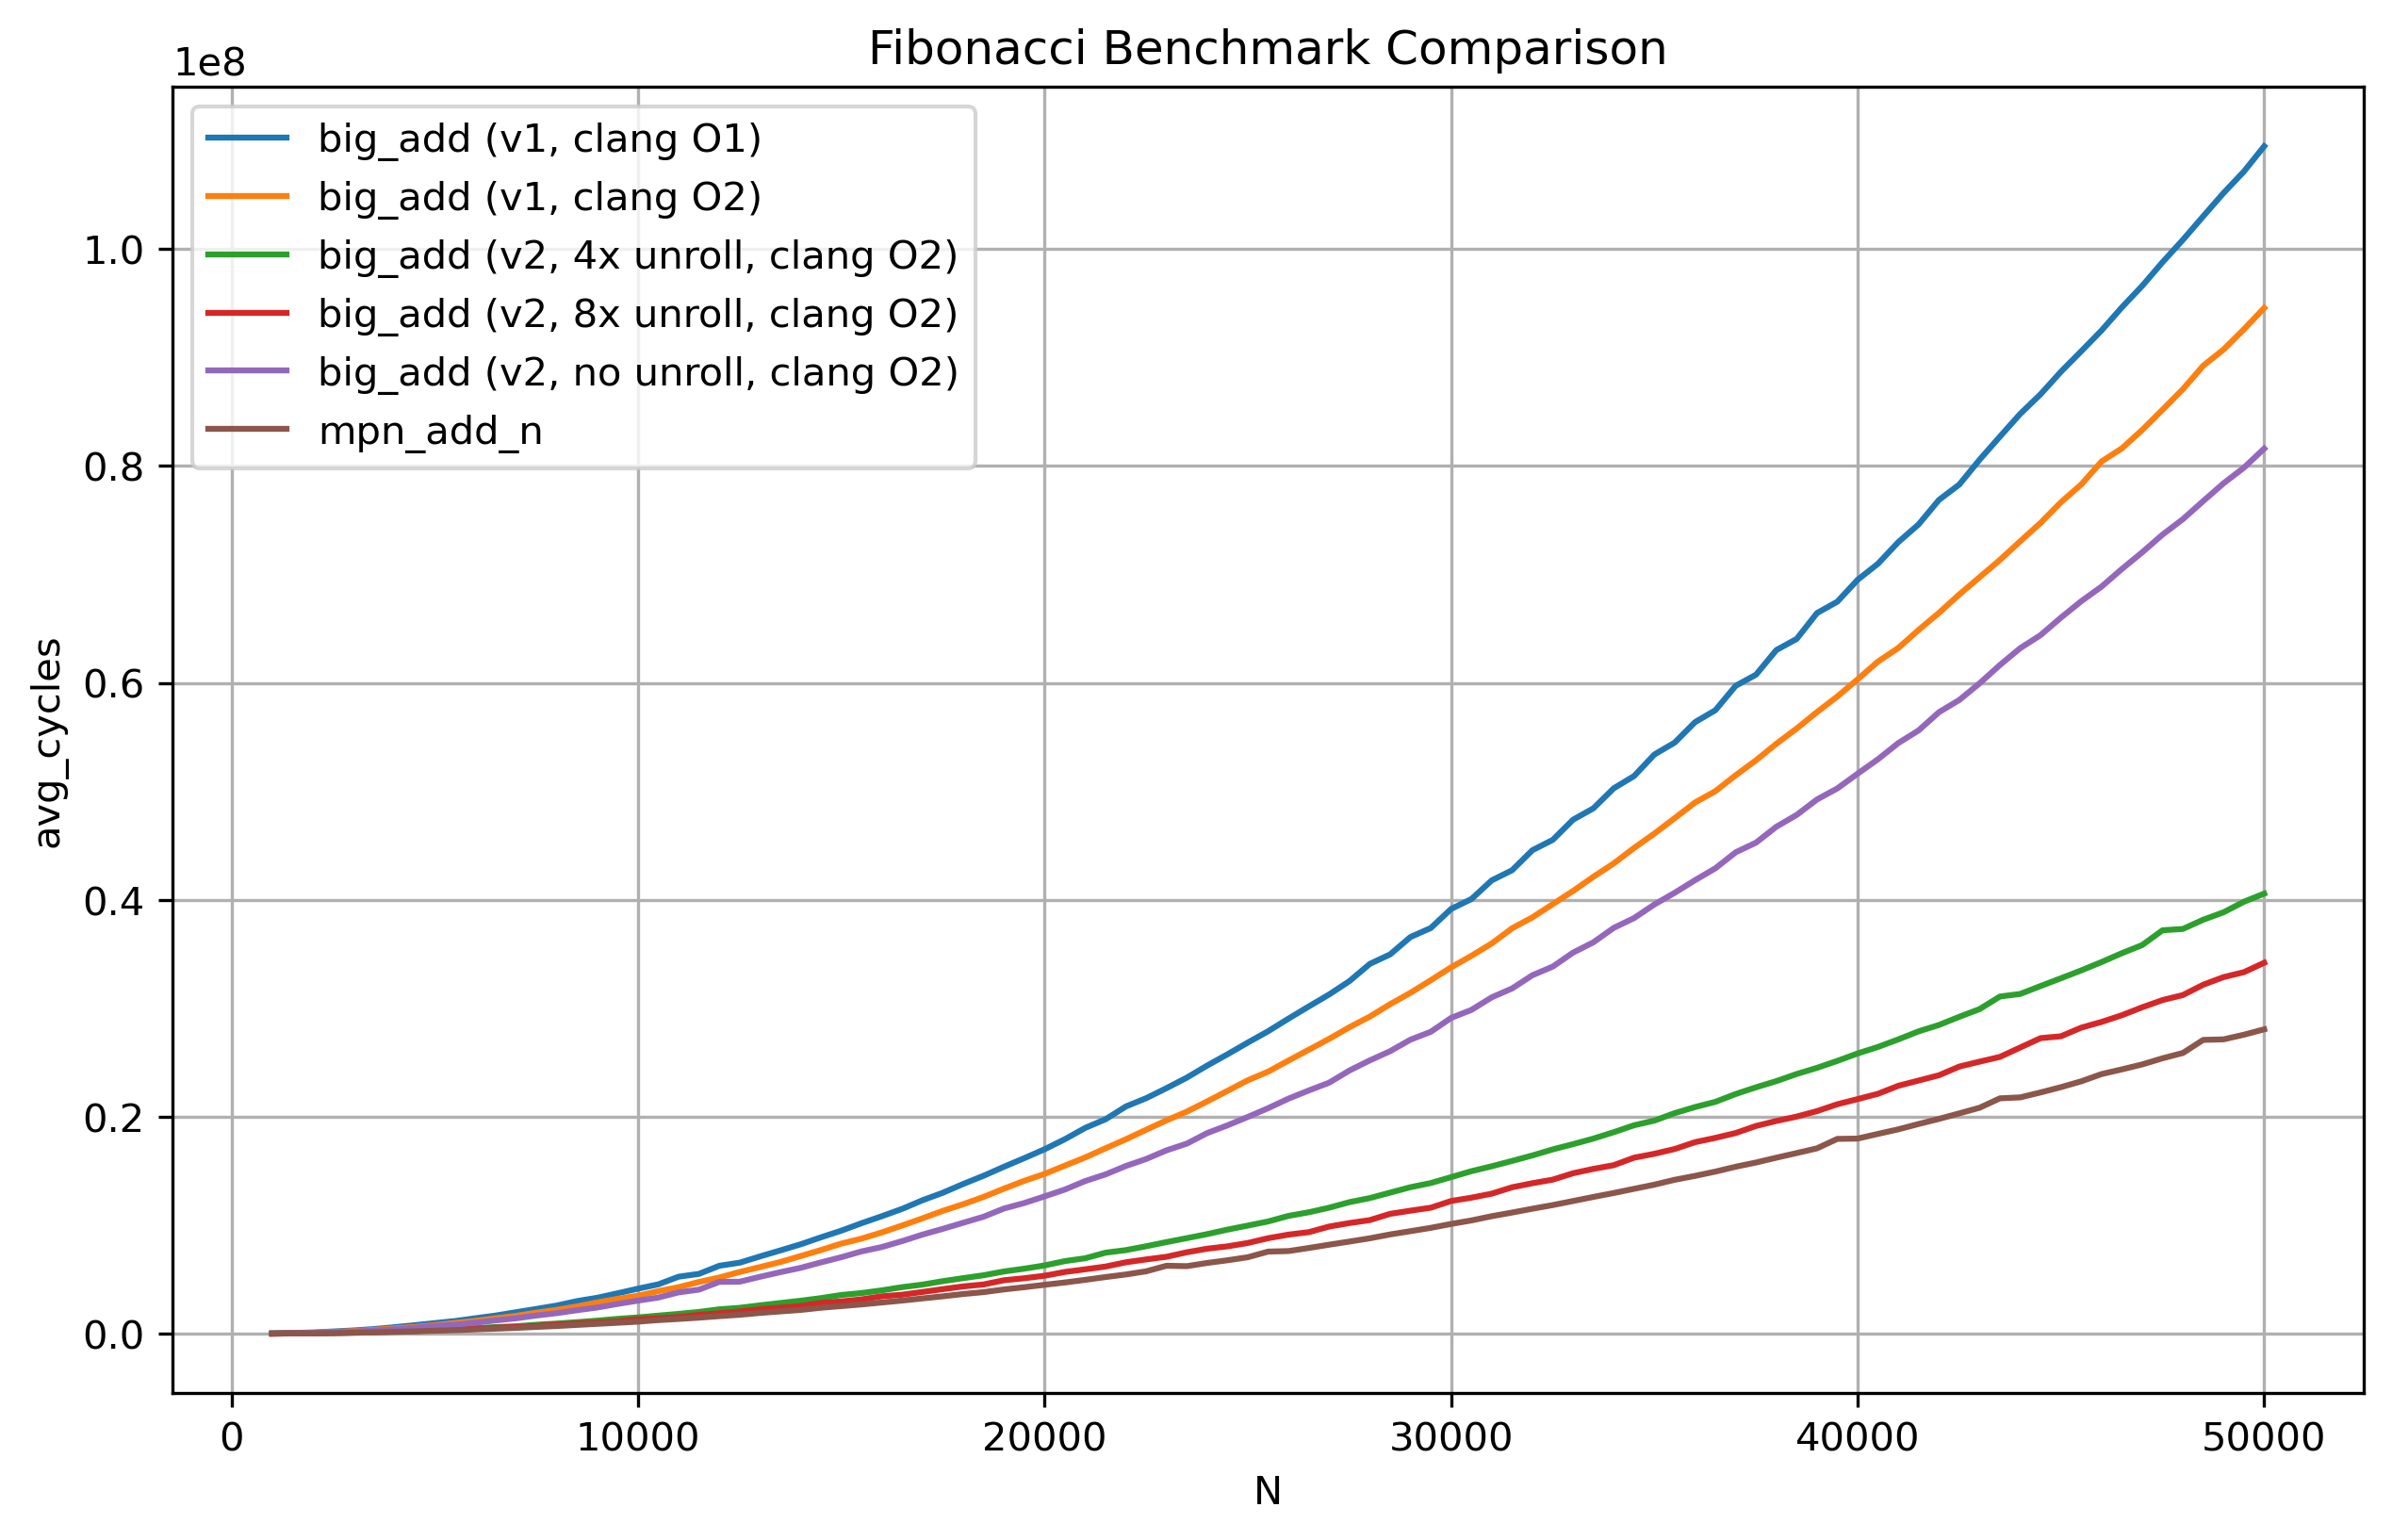
Now that we have confirmed that the compiler is doing what we expect it to, it’s time to run the benchmark again. Doing so with (1), (2) and (3) we obtain this plot:
and the following table:
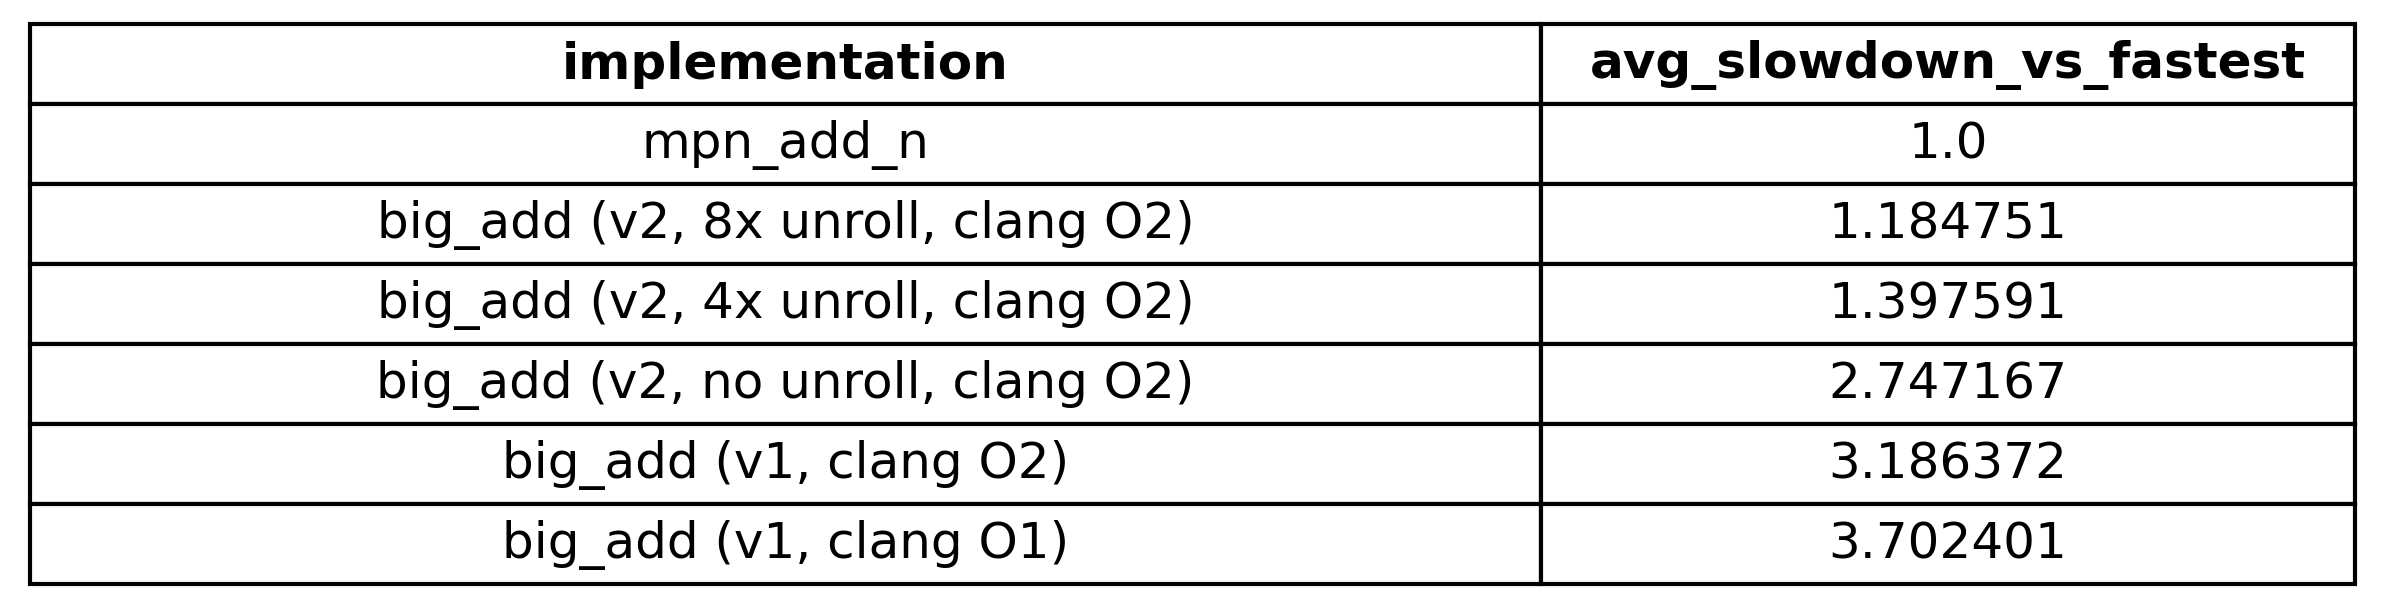
Our no unroll big_add_v2 variant is a little faster than the O2 optimization level big_add_v1. Then our 4x unroll big_add_v2 sees a really big jump in performance down to just ~40% slower than mpn_add_n! Comparatively, the 8x unroll variant sees a much smaller gain from the 4x unroll variant. Nonetheless, using specialized instructions for our target hardware and employing methods such as loop-unrolling for optimal resource utilization did help quit a lot.
Since the no unroll big_add_v2 and the portable C variants are simply getting outclassed by several magnitudes by the other three functions, I’ll prune those from the plot to reduce the noise. Doing that and scaling the graph once more, we have:
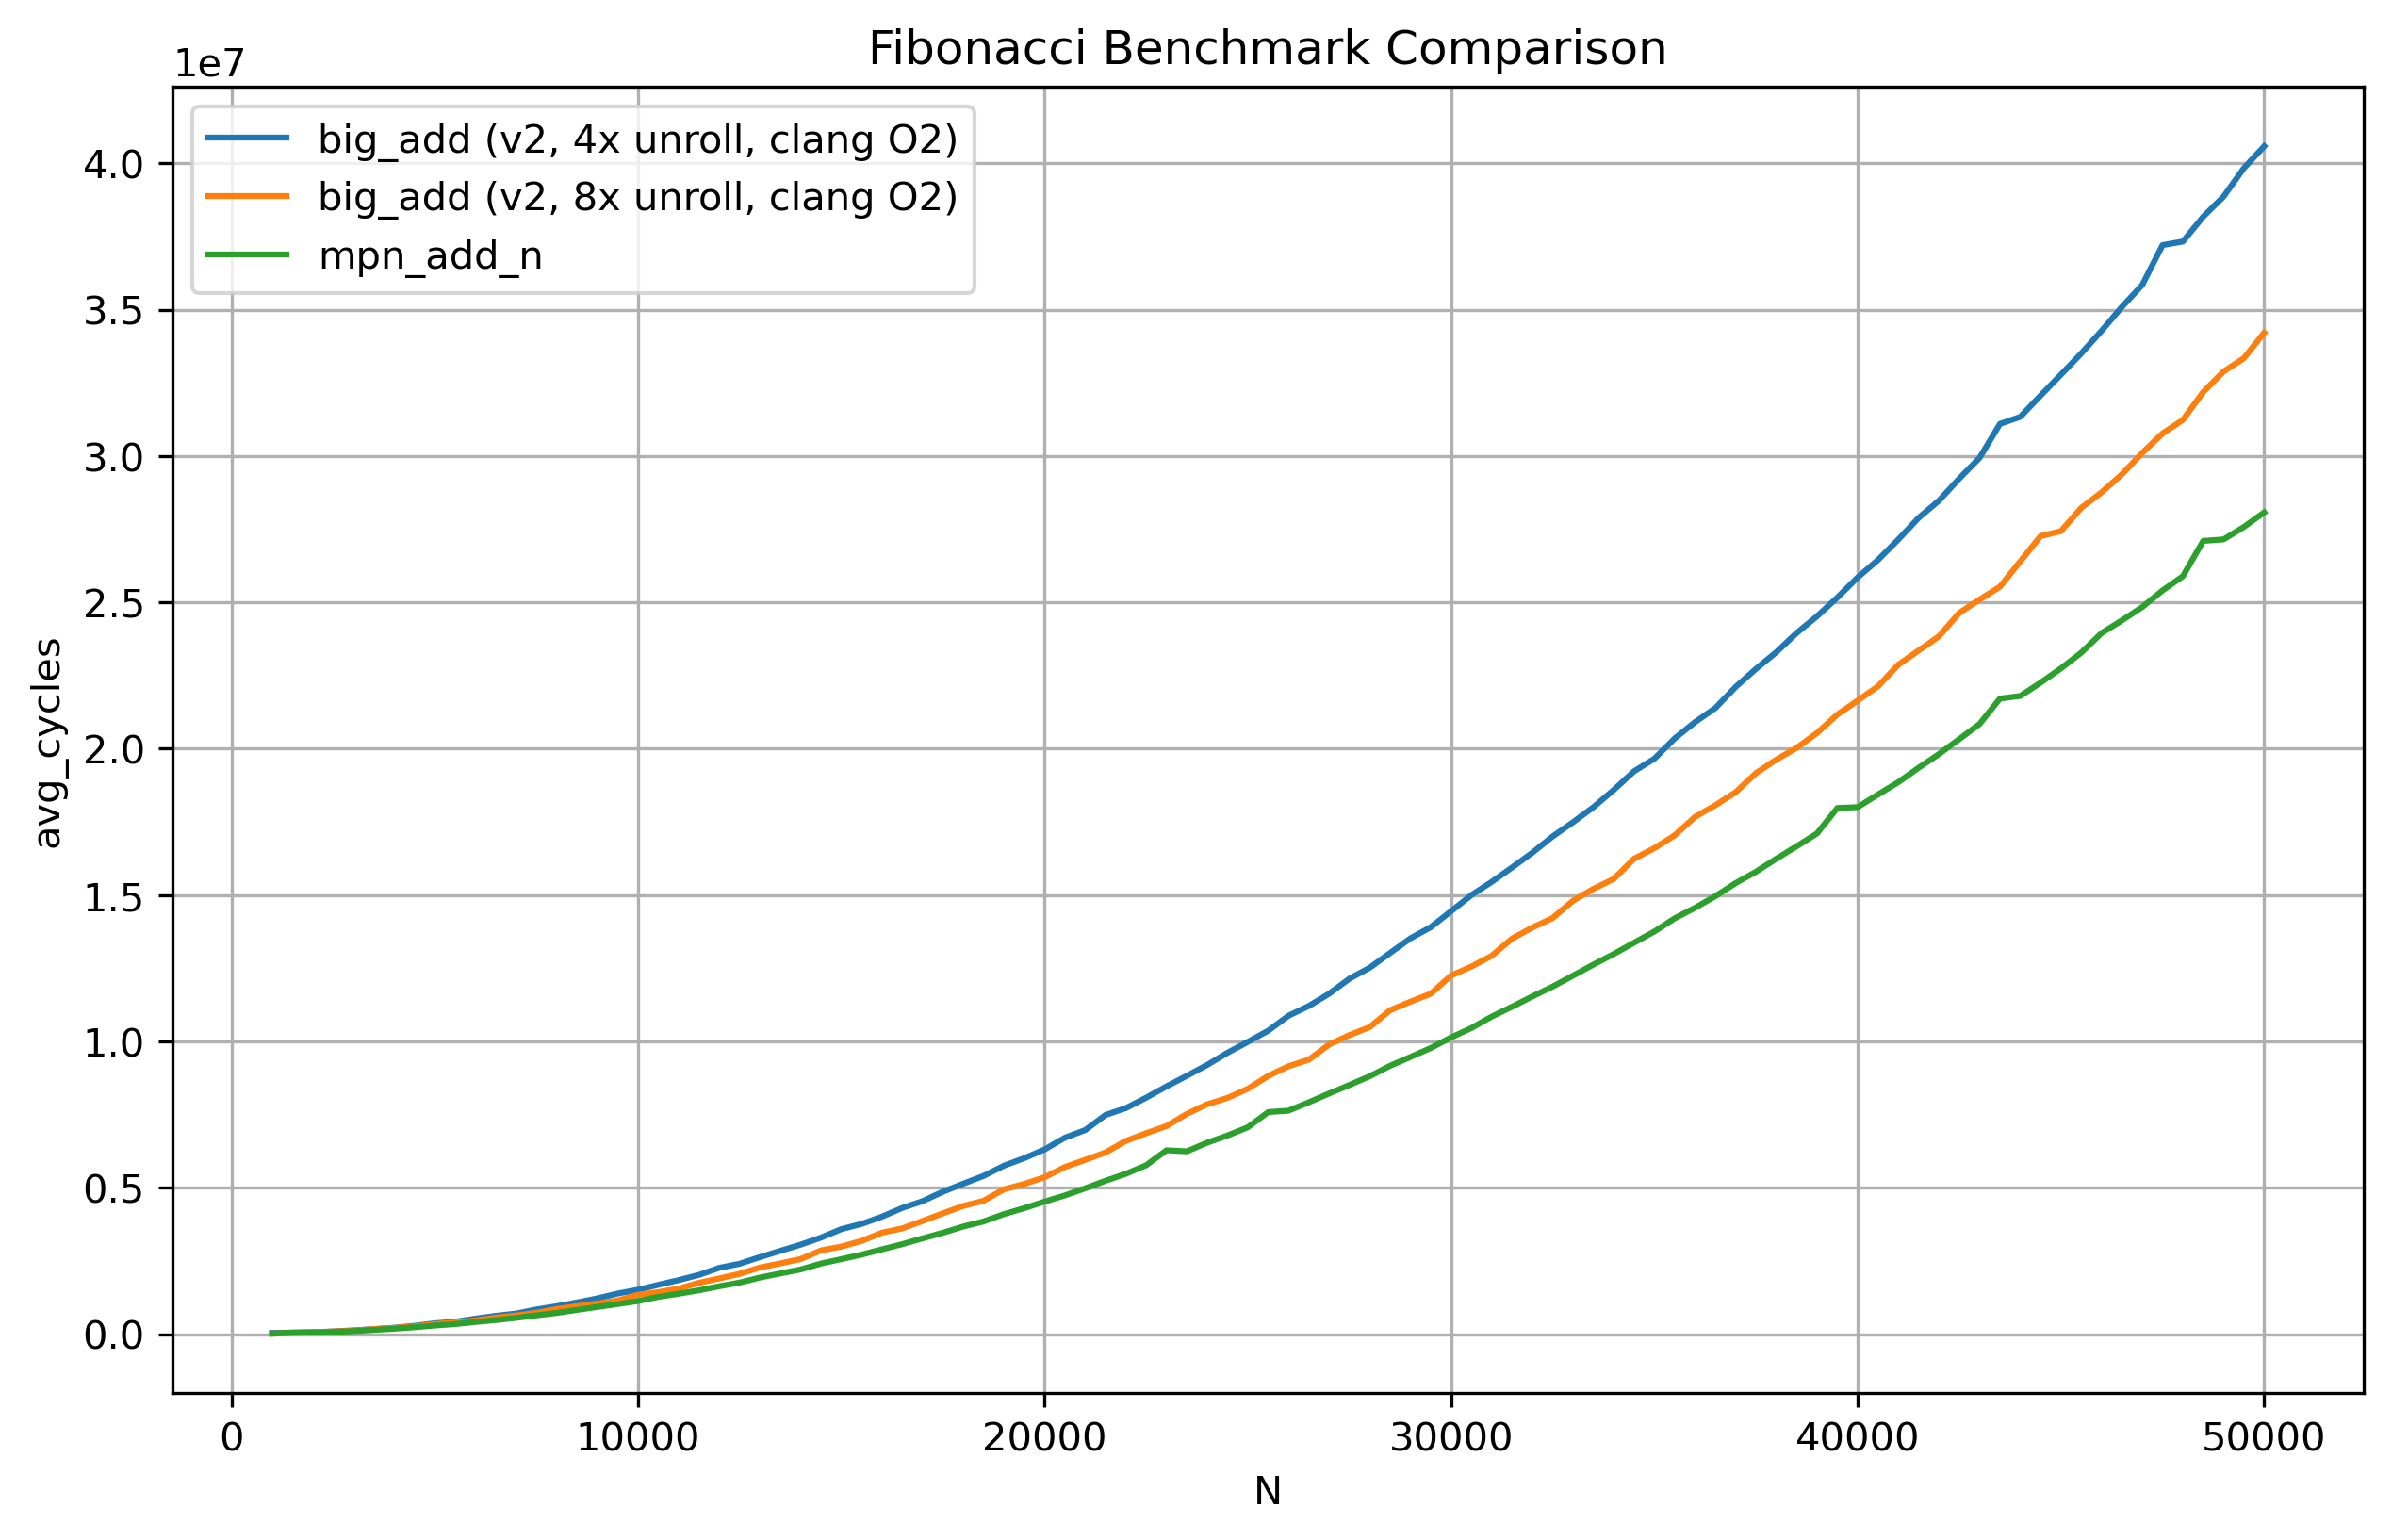
With a cheap re-write of our code, we have tripled the performance of our big_add routine! Now we can stop here, knowing we have done a good enough job.
Or if you are like me and have a schtick about writing as fast code as you can, then we aren’t done here … not just yet. It’s time for maximum power.

Going even further
I got to know a saying a while back from a systems programmer which really stuck with me.
“The best code optimizer sits between your ears …”
With this insight in hand, we can start taking some of the burden off the compiler and handle part of the optimization ourselves. But first, we need to identify which part of the program is responsible for the performance bottleneck.
We can profile our program with a sampling profiler such as Linux’s perf. Once again, compiling the 8x unrolled big_add_v2 with our compiler using the -g and -fno-omit-frame-pointer flags, we can get debug info and symbols in our program which perf can utilize to make a detailed stack trace and give us information about how much time is being spent in each function.
Doing the following
perf record -g ./fib_bench.out  # getting perf to profile our program
perf report                     # looking at the stack trace
yields the output in the image below.

We can see that ~99.5% of our time is being spent in big_add_v2. Since that is the hot-spot massively dominating our run time, re-writing just that part will single-handedly improve our program performance.
Getting serious in our analysis of code performance
Up to this point, we have discussed performance mostly in qualitative terms. However, if we want to conduct a serious analysis, we must begin reasoning in terms of quantitative metrics; otherwise, how would we know whether our code is actually getting faster or more efficient?
Therefore, the next part will be quite dense in terms of terminology and technical material. Before proceeding, I strongly recommend familiarity with the following:
How to read x86-64 assembly language and related concepts
CPU architecture concepts like (but not limited to) pipelining, out-of-order execution, and data hazards
How to reason about assembly code performance using data-flow graphs
Carefully looking at compiler code-gen
Let’s start by carefully examining the x86-64 assembly code of big_add_v2 generated by the compiler when we specify the #pragma nounroll pre-processor directive.
big_add_v2:
        xor     eax, eax
        test    rcx, rcx
        je      .LBB0_4
        xor     r8d, r8d
.LBB0_2:
        mov     r9, qword ptr [rsi + 8*rax]
        add     r8b, -1
        adc     r9, qword ptr [rdx + 8*rax]
        setb    r8b
        mov     qword ptr [rdi + 8*rax], r9
        inc     rax
        cmp     rcx, rax
        jne     .LBB0_2
        movzx   eax, r8b
.LBB0_4:
        ret
We can see that the core of our function, which corresponds to the while loop from our C code, is contained in the snippet below:
.LBB0_2:
    mov     r9, qword ptr [rsi + 8*rax]    # load the value from op1[i] into reg r9
    add     r8b, -1                        # set the carry flag based on prev iter
                                           # by conditionally overflowing r8b
    adc     r9, qword ptr [rdx + 8*rax]    # perform (op1[i] + op2[i] + CF)
    setb    r8b                            # set reg r8b as per the new value of CF
    mov     qword ptr [rdi + 8*rax], r9    # store in result[i]
    inc     rax                            # increment i
    cmp     rcx, rax                       # compare i with size
    jne     .LBB0_2                        # jump back to label if i != size
Before I go on and discuss on what the code is doing, I just want to quickly point out that since we are on a x86-64 Linux based system, our code calling convention is the System V AMD64 ABI. This means that the four arguments to our C function, pointers result, op1, op2 and unsigned integer argument size, are passed in the following registers:
resultinrdiop1inrsiop2inrdxsizeinrcx
More over, the code uses the register r8, r9 and rax all of which are caller-saved registers as per the ABI and therefore free for use by the callee without the need to push anything to the stack. With that out of the way, let’s discuss what the code is doing.
The memory addressing operations used by the two mov’s and the one adc is fairly straight forward, with our indexing value i being the register rax. It is scaled by eight times to fetch a new 64-bit or 8-byte value in every iteration.
The setb instruction is setting the byte register r8b to either 0 or 1 based on the value of carry flag obtained in current iteration of the loop. The next iteration sets the carry flag by performing add, adding -1 to r8b, which is equivalent to unsigned 8-bit value of 255 on a 2’s complement machine such as this one. Since 255 is already the maximum unsigned integer value that can be fit in a 8-bit register, if r8b is already 1 from the previous iteration, the addition overflows, setting the overflow and carry flags. If it is 0, then nothing happens and r8b simply holds the value of 255. Then the setb instruction clobbers the existing value again with either 0 or 1.
The reason for storing and then restoring the value of the carry flag per iteration is because of the cmp instruction. The cmp instruction performs a subtraction of rax from rcx without storing the final result in rcx and based on this result, it sets the flags in the flag register. Then, the condition of the zero flag is used to determine whether jne performs the jump back to the label LBB0_2 or just lets execution fall through. Do note that the inc instruction, used to increment the value within rax does not modify the carry flag.
Next let’s draw the data-flow graph for the above loop. While drawing the data-flow graph, we need to keep in mind the techniques utilized by modern CPU’s, such as register renaming, which get rid of false dependencies such as WAR (Write after Read) and WAW (Write after Write) Hazards.
I would like to encourage you to first attempt to draw the data-flow graph on your own, before moving on to look at the image below.
Ready? Here’s mine:
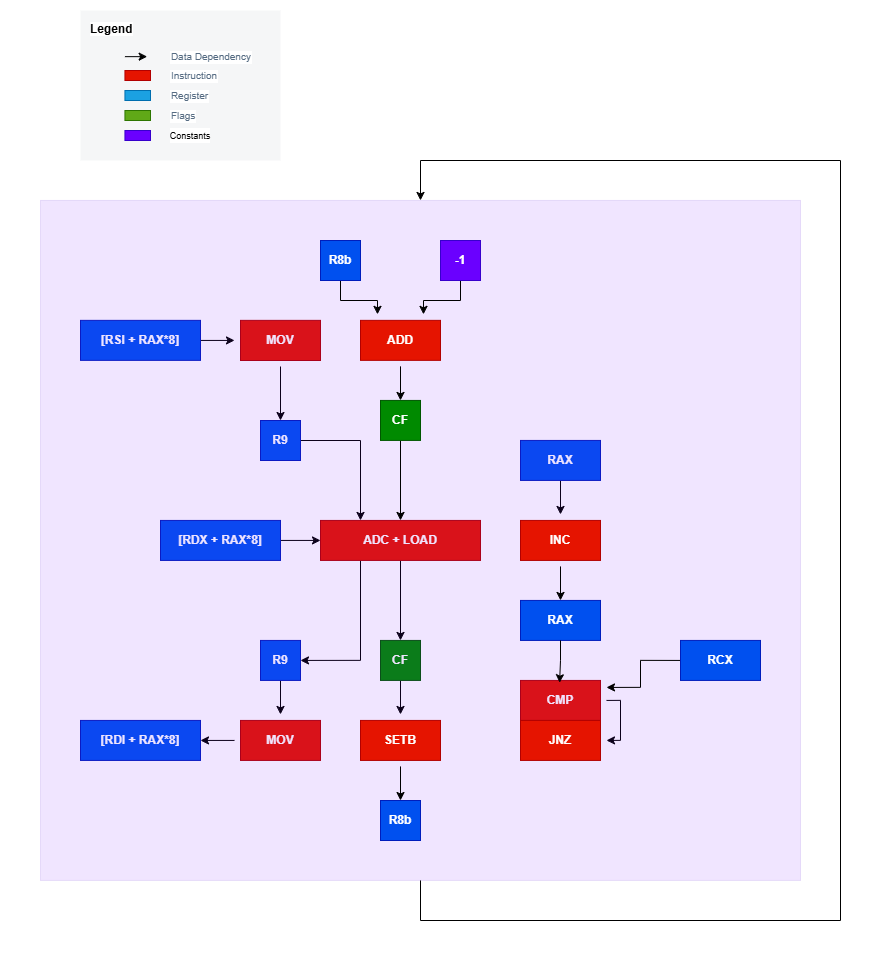
Let’s examine the above data-flow graph more carefully. First and foremost, a single iteration of our loop is signified by the light purple box. Inside it we can see we have two separate data flow chains. One chain is performing the actual computation needed while the other one forms the loop control flow. There is a WAR dependency between the two data flow chains on the register rax, but that is remedied by any modern CPU with register renaming. Thanks to out-of-order, speculative and super-scalar execution in a CPU these two data flow chains essentially form two instruction-level parallel streams.
Another small thing to note is the two memory loads (where one is performed as a micro-op within the ADC call) and the one store performed by reading the contents of registers rsi, rdx and rdi can also be executed in an out-of-order fashion by register renaming of r9.
So to determine which of these chains is the bottleneck in this code, we have to find what is called the critical path of the code. The critical path in a data-flow graph of assembly code is the chain of data dependencies with the longest total execution latency. This path ultimately determines the maximum throughput of the code, since it represents the fundamental performance bottleneck. Since every instruction in this chain must execute in a serial fashion and it ultimately dominates in determining the performance of our code.
Utilizing the llvm-mca tool on the Compiler Explorer website after setting the language to analysis, we can pass in the assembly code to view the performance metrics of our code. I am passing in an additional argument, -mcpu=znver4, as my CPU belongs to the AMD Zen 4 micro-architecture.
Looking at the output here we can see the latency as well as micro-ops of our instructions within the loop. Based on this information as well the information for the instructions for Zen 4 micro-architecture from uops info table, can you determine the critical path and its latency? Try and see if you can figure it out before looking at the image below.
Here’s the answer:
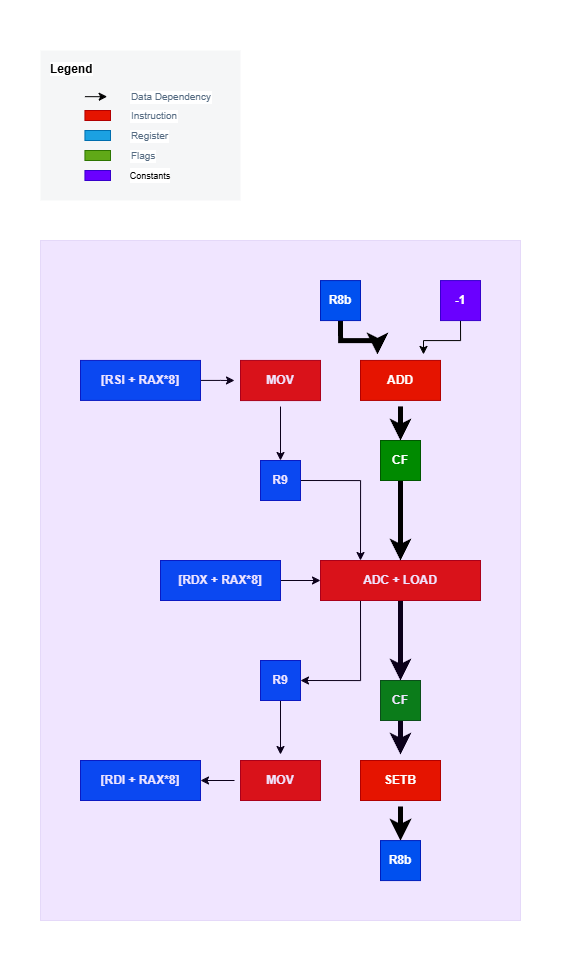
If the chain of instructions formed by the emboldened arrows is what you answered, then you are correct. As for the latency, it’s (in theory) ~3 cycles long. The reason being a single cycle for the add, setb and adc instructions each. You might think that the adc instruction should have the latency of ~5 cycles due to having a memory operand, but such instructions on most CPU micro-architectures get decomposed into two micro-ops, and in this case, it’s one micro-op to fetch the value from memory and another to perform the actual add-with-carry. The first micro-op can be executed ahead of time and thus the actual bottleneck is the add-with-carry with a latency of one cycle. With the loop unrolled four times, we get the following critical path in our code:
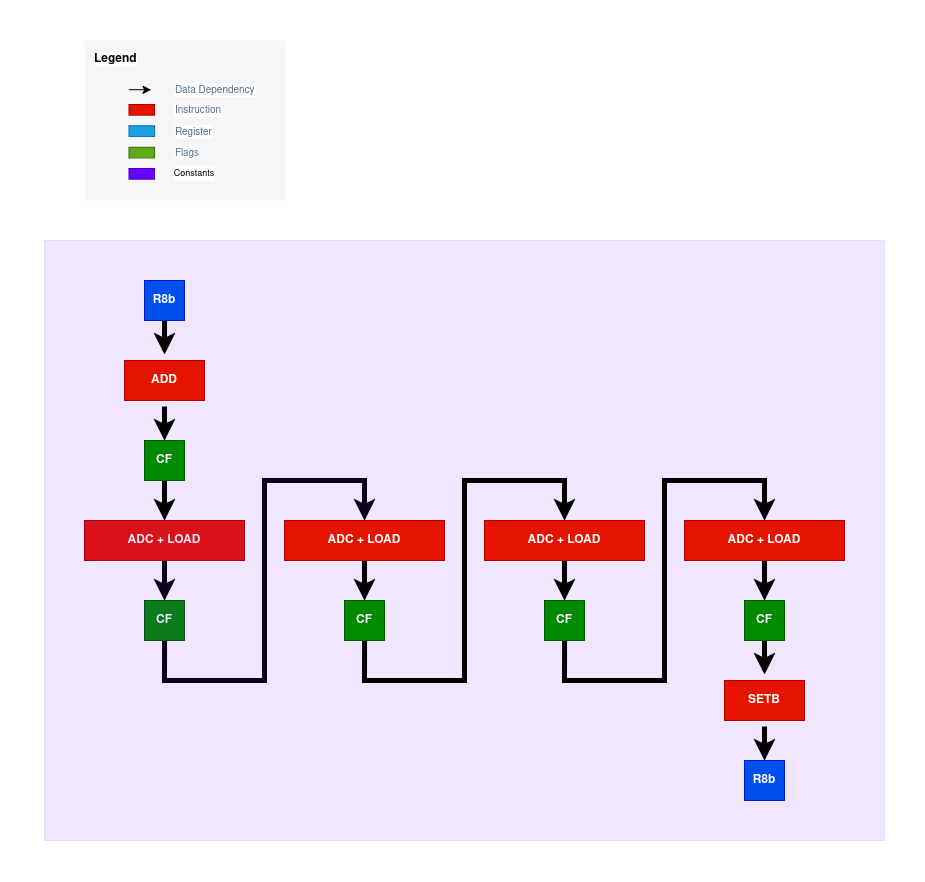
Similarly, the eight times unrolled version will have eight adc instructions on the critical path for every add and setb.
The question still remains though, can we do better than the compiler by eliminating unnecessary work on the critical path?
Choosing control flow instructions carefully
The reason for having the extra work added by the add and setb instructions in our critical path is simply due to the comparison we perform using cmp. The cmp instruction modifies the carry flag based on it’s result, which happens to be a problematic side effect for us. The good news is that the jne instruction only performs the jump based on the condition of the zero flag. If we can somehow avoid modifying the carry flag, we will have the solution to our problem.
Looking at the instructions that are available on x86-64 processors, there’s these 3 instructions can do what we need here:
lea- Load Effective Addressdec- Decrement By 1inc- Increment By 1
Looking at the descriptions provided in the links, the lea instruction doesn’t modify any flags. Meanwhile, the inc and dec instructions do modify the zero flag but not the carry flag. Bingo! Now all we need to do is utilize them in our loop control flow instead of cmp.
Here’s the first variant
main_loop:

  mov    r9, QWORD PTR [rsi + rax * 8]
  adc    r9, QWORD PTR [rdx + rax * 8]
  mov    QWORD PTR [rdi + rax * 8], r9

  inc    rax
  dec    rcx
  jnz    main_loop
Now instead of just incrementing our loop indexing value stored in rax and then comparing it to rcx and clobbering the results of adc, we instead use the dec instruction on rcx and then jump using jnz based on whether the zero flag is set or not, which happens to be set by the preceding dec instruction when rcx reaches zero.
Now, simply by inspecting the code and applying our previous knowledge, we can see that the previously critical path of ~3 cycles of latency has been reduced down to a single cycle!
But before we go on and benchmark our assembly code, I want to see if we can do even better.
One final effort
Our hand-written assembly code as well as the compiler generated assembly utilizes what’s known as double register addressing in memory operands. This can be more expensive compared to single register addressing. Since we are trying to optimize our code for the AMD Zen 4 micro-architecture, taking a look at its official optimization manual is a wise move. Looking at the manual’s section 2.3, we get:
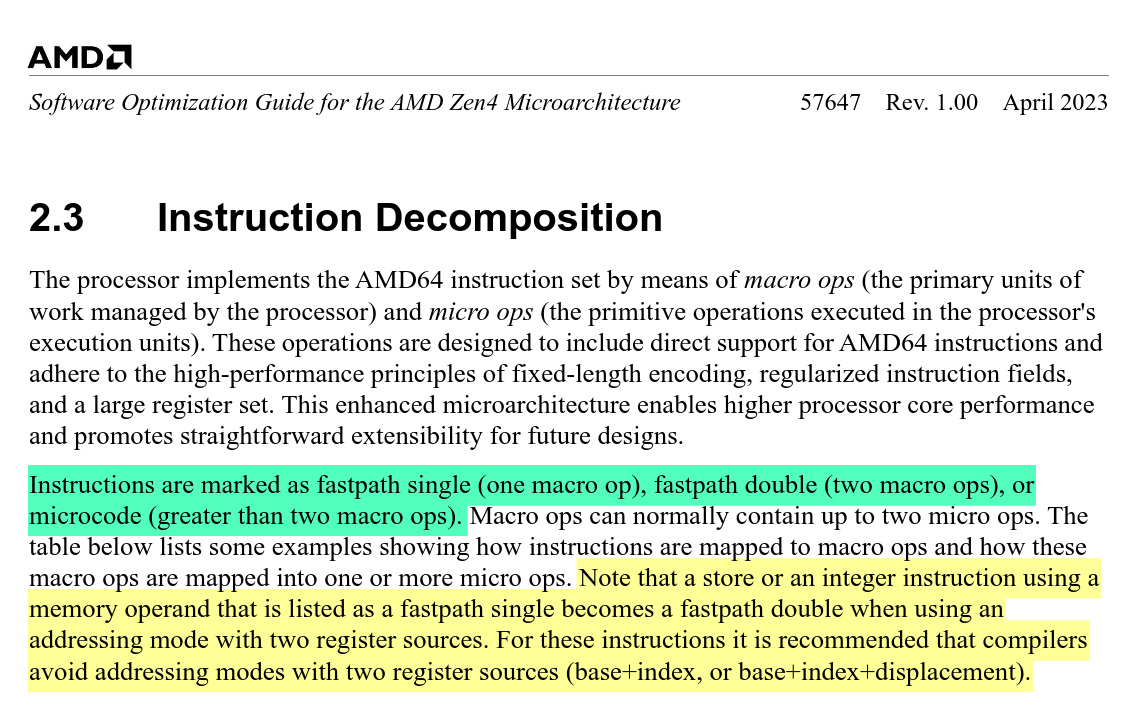
Notice the parts highlighted in green and yellow. Integer and store instructions that use double register indexing can no longer benefit from micro-op fusion and stay as two separate instructions instead of being fused into one. With respect to our assembly code, the adc and the immediately following mov could have been handled as a single fused micro-op, had we used single register addressing. An alternative version of our code utilizing the lea instruction could’ve been:
main_loop:

  mov    r9, QWORD PTR [rsi]
  adc    r9, QWORD PTR [rdx]
  mov    QWORD PTR [rdi], r9

  lea    rsi, [rsi + 8]
  lea    rdx, [rdx + 8]
  lea    rdi, [rdi + 8]
  dec    rcx
  jnz    main_loop
Now it might seem redundant to add in three micro-ops from each lea instruction and removing three micro-ops, one from the inc, one from adc and one from store in mov. But the reasoning behind will be more apparent when we unroll the loop four times (or more).
main_loop:

  mov    r9,  QWORD PTR [rsi]
  adc    r9,  QWORD PTR [rdx]
  mov    QWORD PTR [rdi], r9

  mov    r9,  QWORD PTR [rsi + 8]
  adc    r9,  QWORD PTR [rdx + 8]
  mov    QWORD PTR [rdi + 8], r9

  mov    r9,  QWORD PTR [rsi + 16]
  adc    r9,  QWORD PTR [rdx + 16]
  mov    QWORD PTR [rdi + 16], r9

  mov    r9,  QWORD PTR [rsi + 24]
  adc    r9,  QWORD PTR [rdx + 24]
  mov    QWORD PTR [rdi + 24], r9

  lea    rsi, [rsi + 32]
  lea    rdx, [rdx + 32]
  lea    rdi, [rdi + 32]

  dec    rcx
  jnz    main_loop
Now by adding 3 micro-ops from the lea’s we have removed 9 micro-ops (8 from four adc’s and mov’s and one from inc)! Reducing the number of micro-ops in assembly code helps with relieving CPU front-end pressure, particularly in the instruction scheduler, as well as pressure from address generation units (AGUs), as some older processors from 2010’s, such as the skylake and haswell micro-architectures from Intel, had a mix of complex and simpler AGUs, with some AGUs only being able to handle single register addressing.
As for decrementing rcx to account for 4 digits of our big integer instead of just 1, we can simply do this:
shr rcx, 2Thus dividing rcx by 4 and then handling the remainders separately in another loop. With this out of the way, here’s what our final assembly code looks like. This part of the code:
.set i, 0
.rept 4

    mov     rax, QWORD PTR [rsi + i * 8]
    adc     rax, QWORD PTR [rdx + i * 8]
    mov     QWORD PTR [rdi + i * 8], rax

.set i, i + 1
.endr
simply utilizes a GAS (GNU Assembler) directive to make the assembler repeat the code four times for us during assembling, thus reducing source code size and potential human errors.
Checking the performance (once more)
Re-writing the benchmark to instead call the function apn_add_n from the libapac repository (after building the library from source), we can run the benchmark again. The following results were obtained:
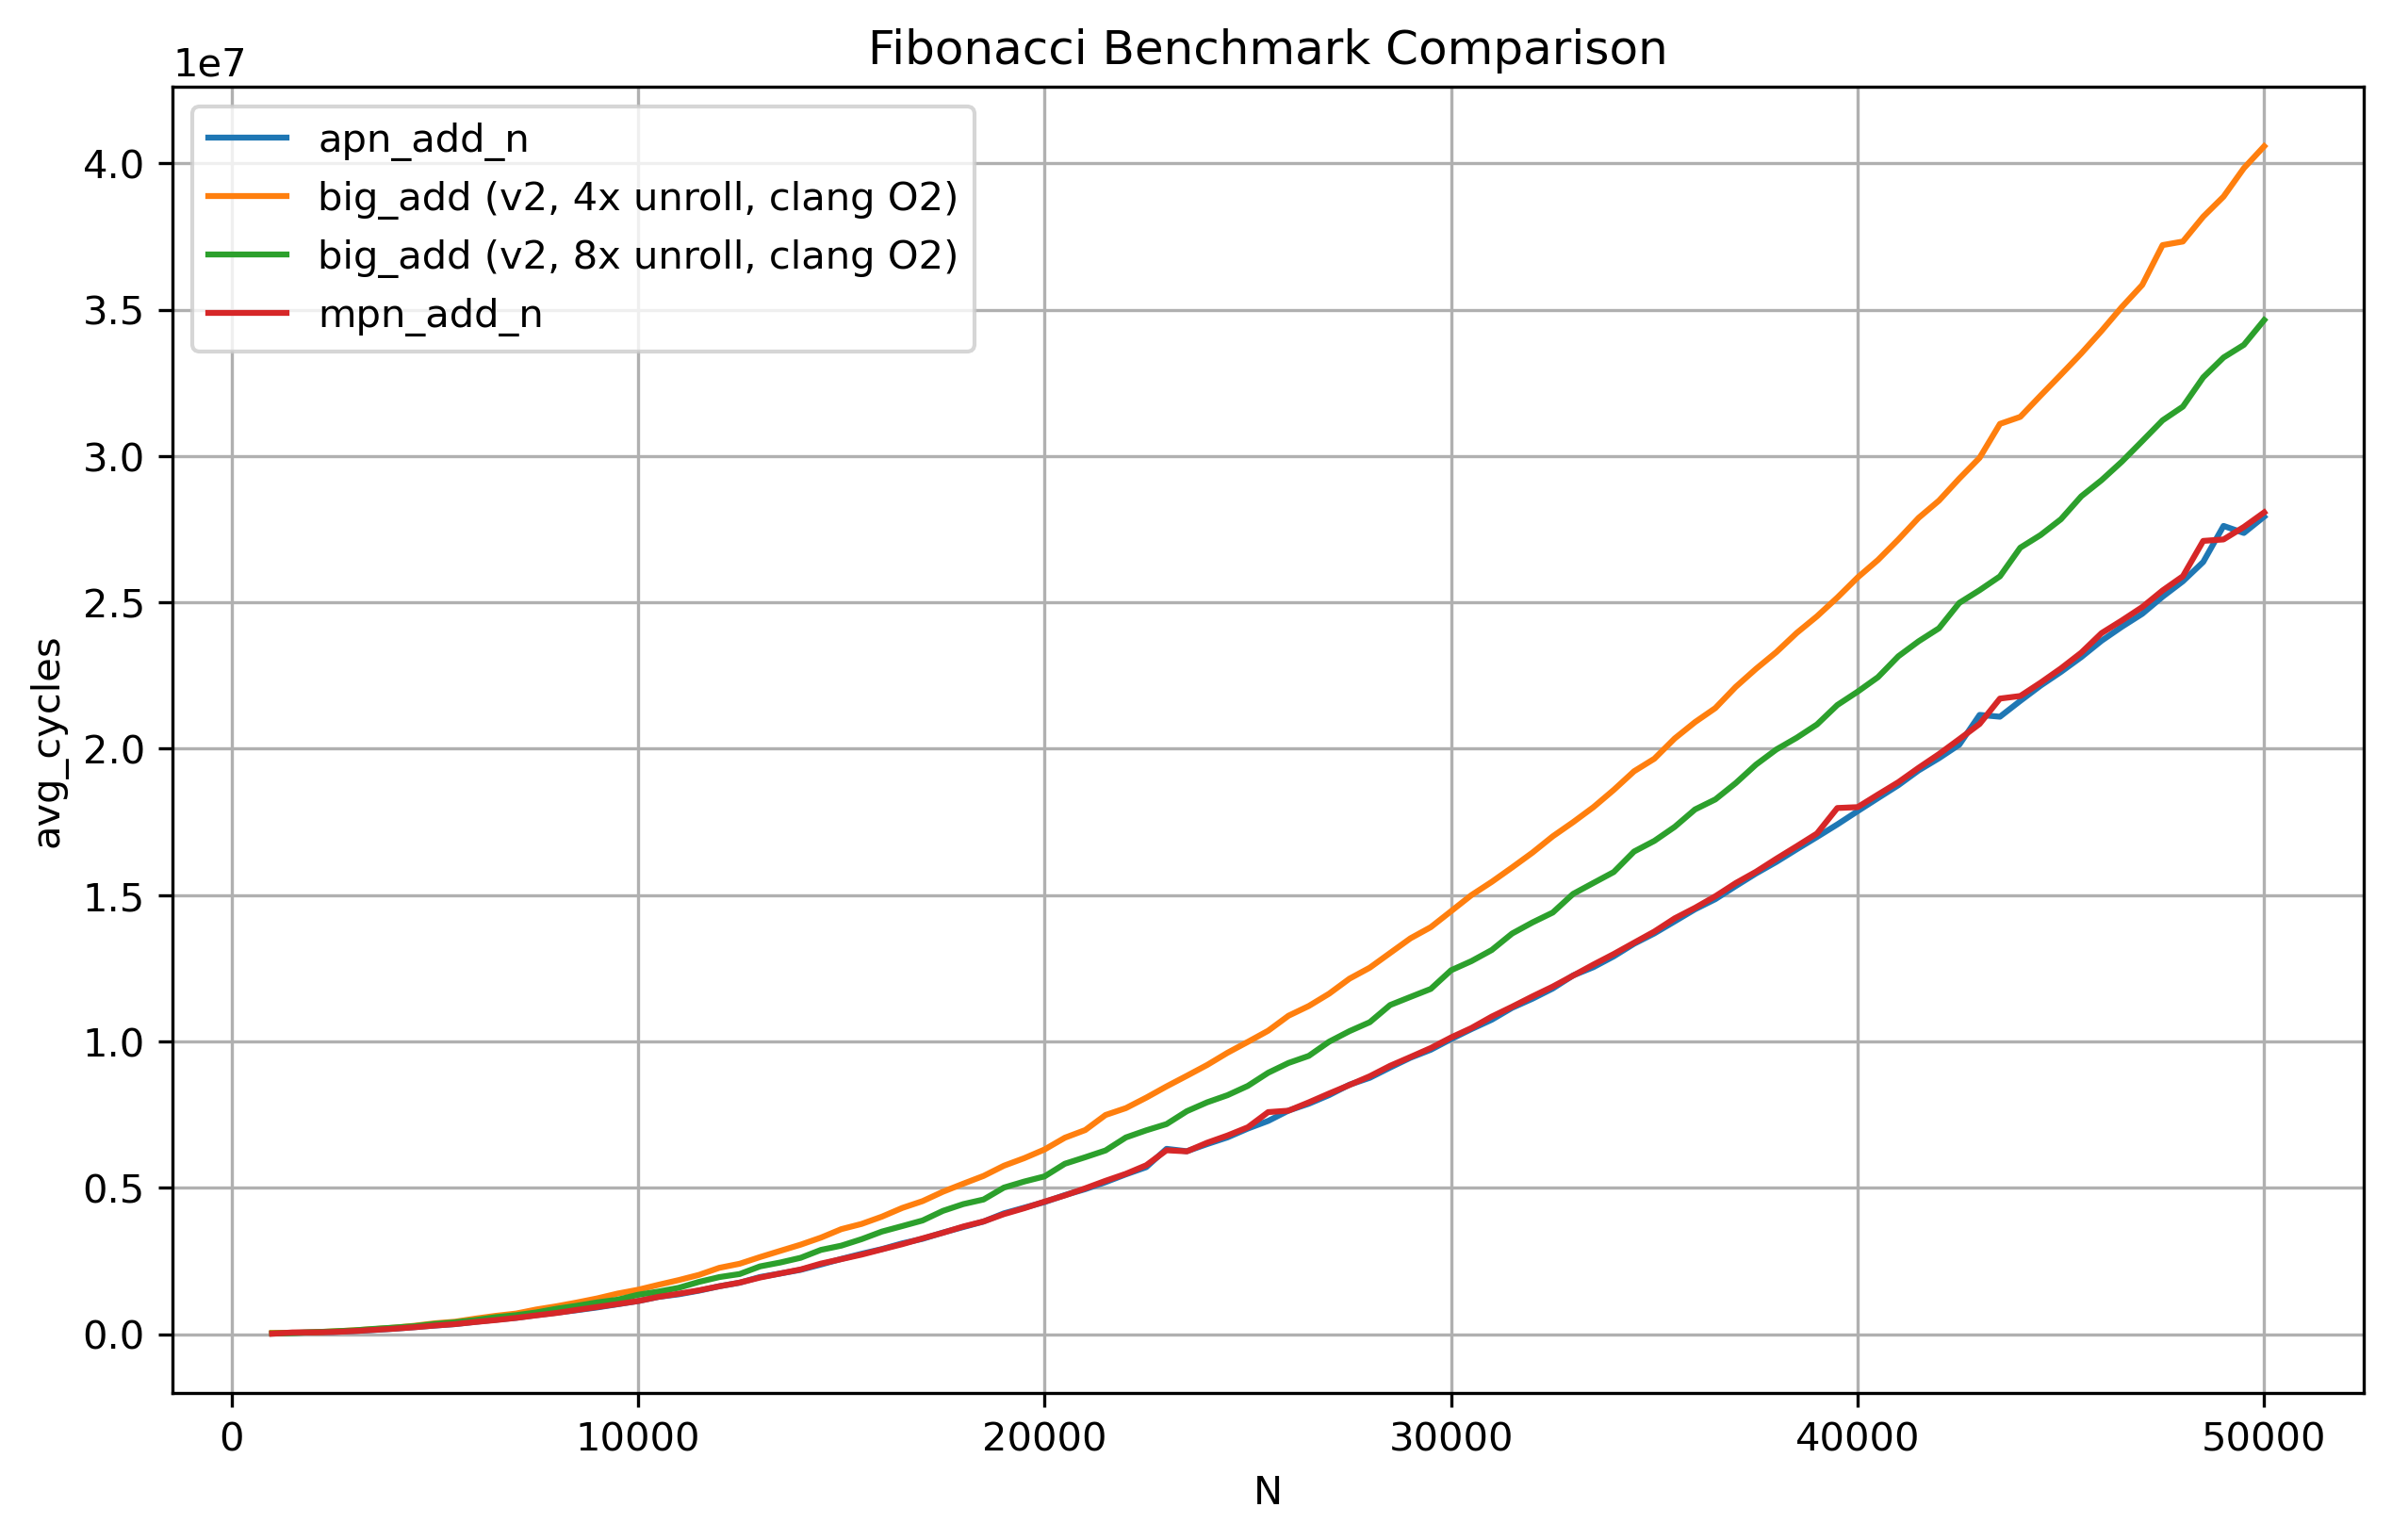
The graph looks a lot more optimistic for us now. Taking a look at the slowdown table from earlier:
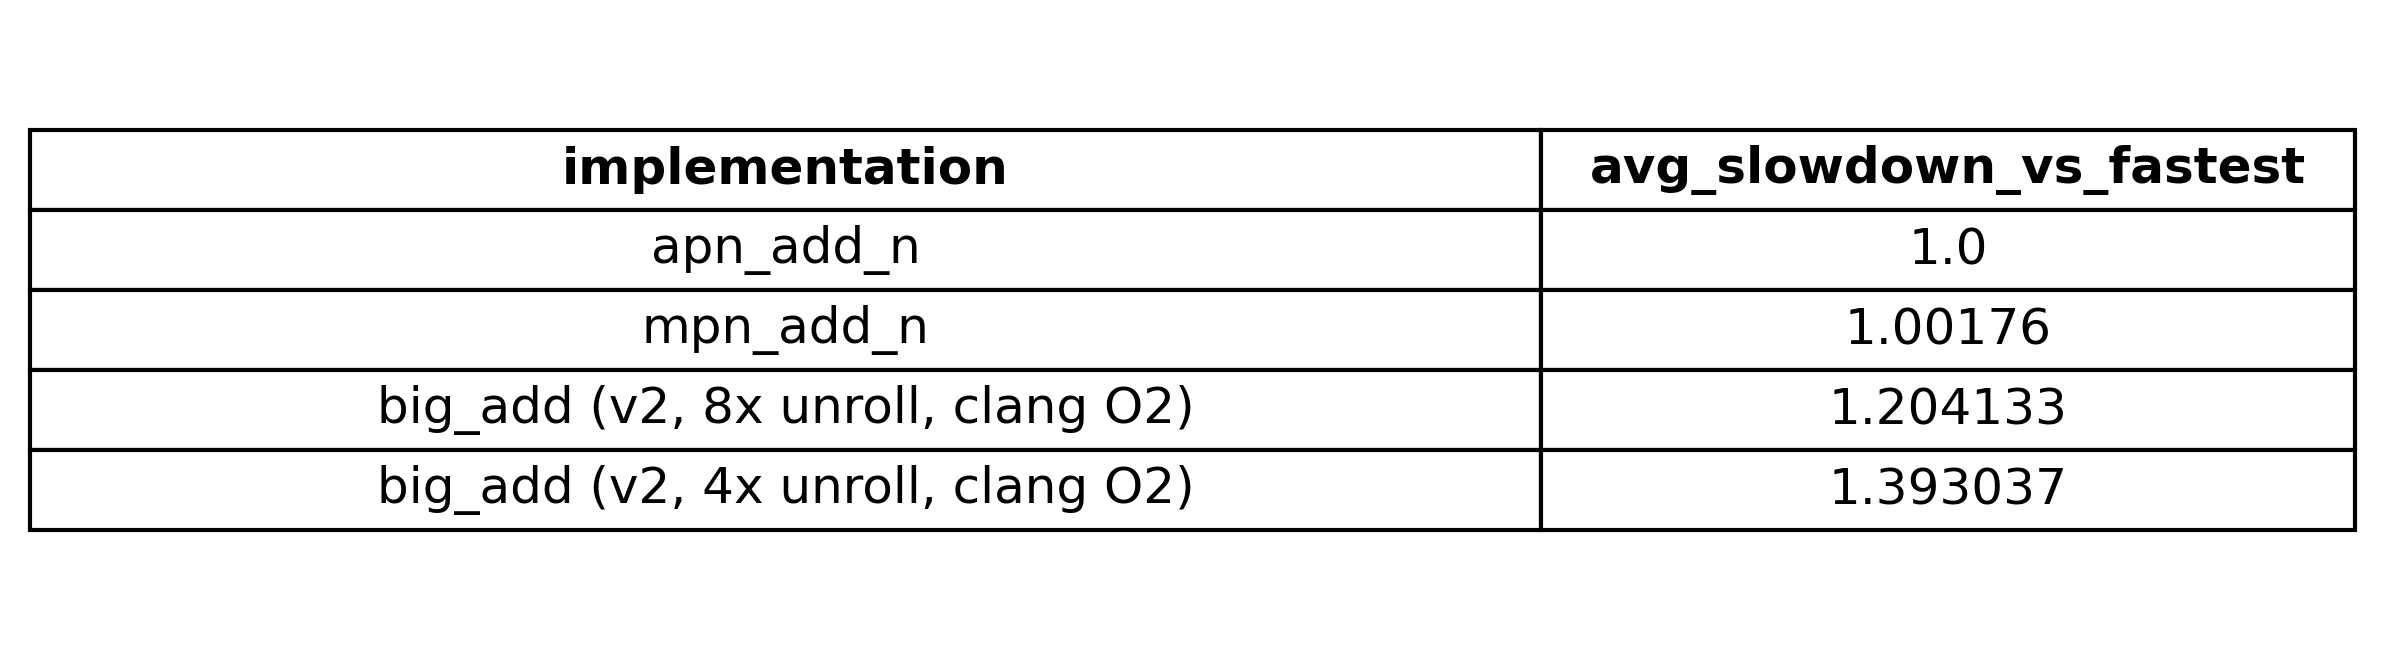
We are now having performance comparable to that of mpn_add_n with our hand-written assembly routine. This is the point where I am satisfied with the performance of my code and now I can stop going further down this rabbit-hole.
What’s next?
In the next blog post, I will be taking a look at how to subtract two big integers.